Import & Export
Container port traffic — Top 30 of 40 major trading economies (2024)
04 Nov 2026 · 06:04 CET
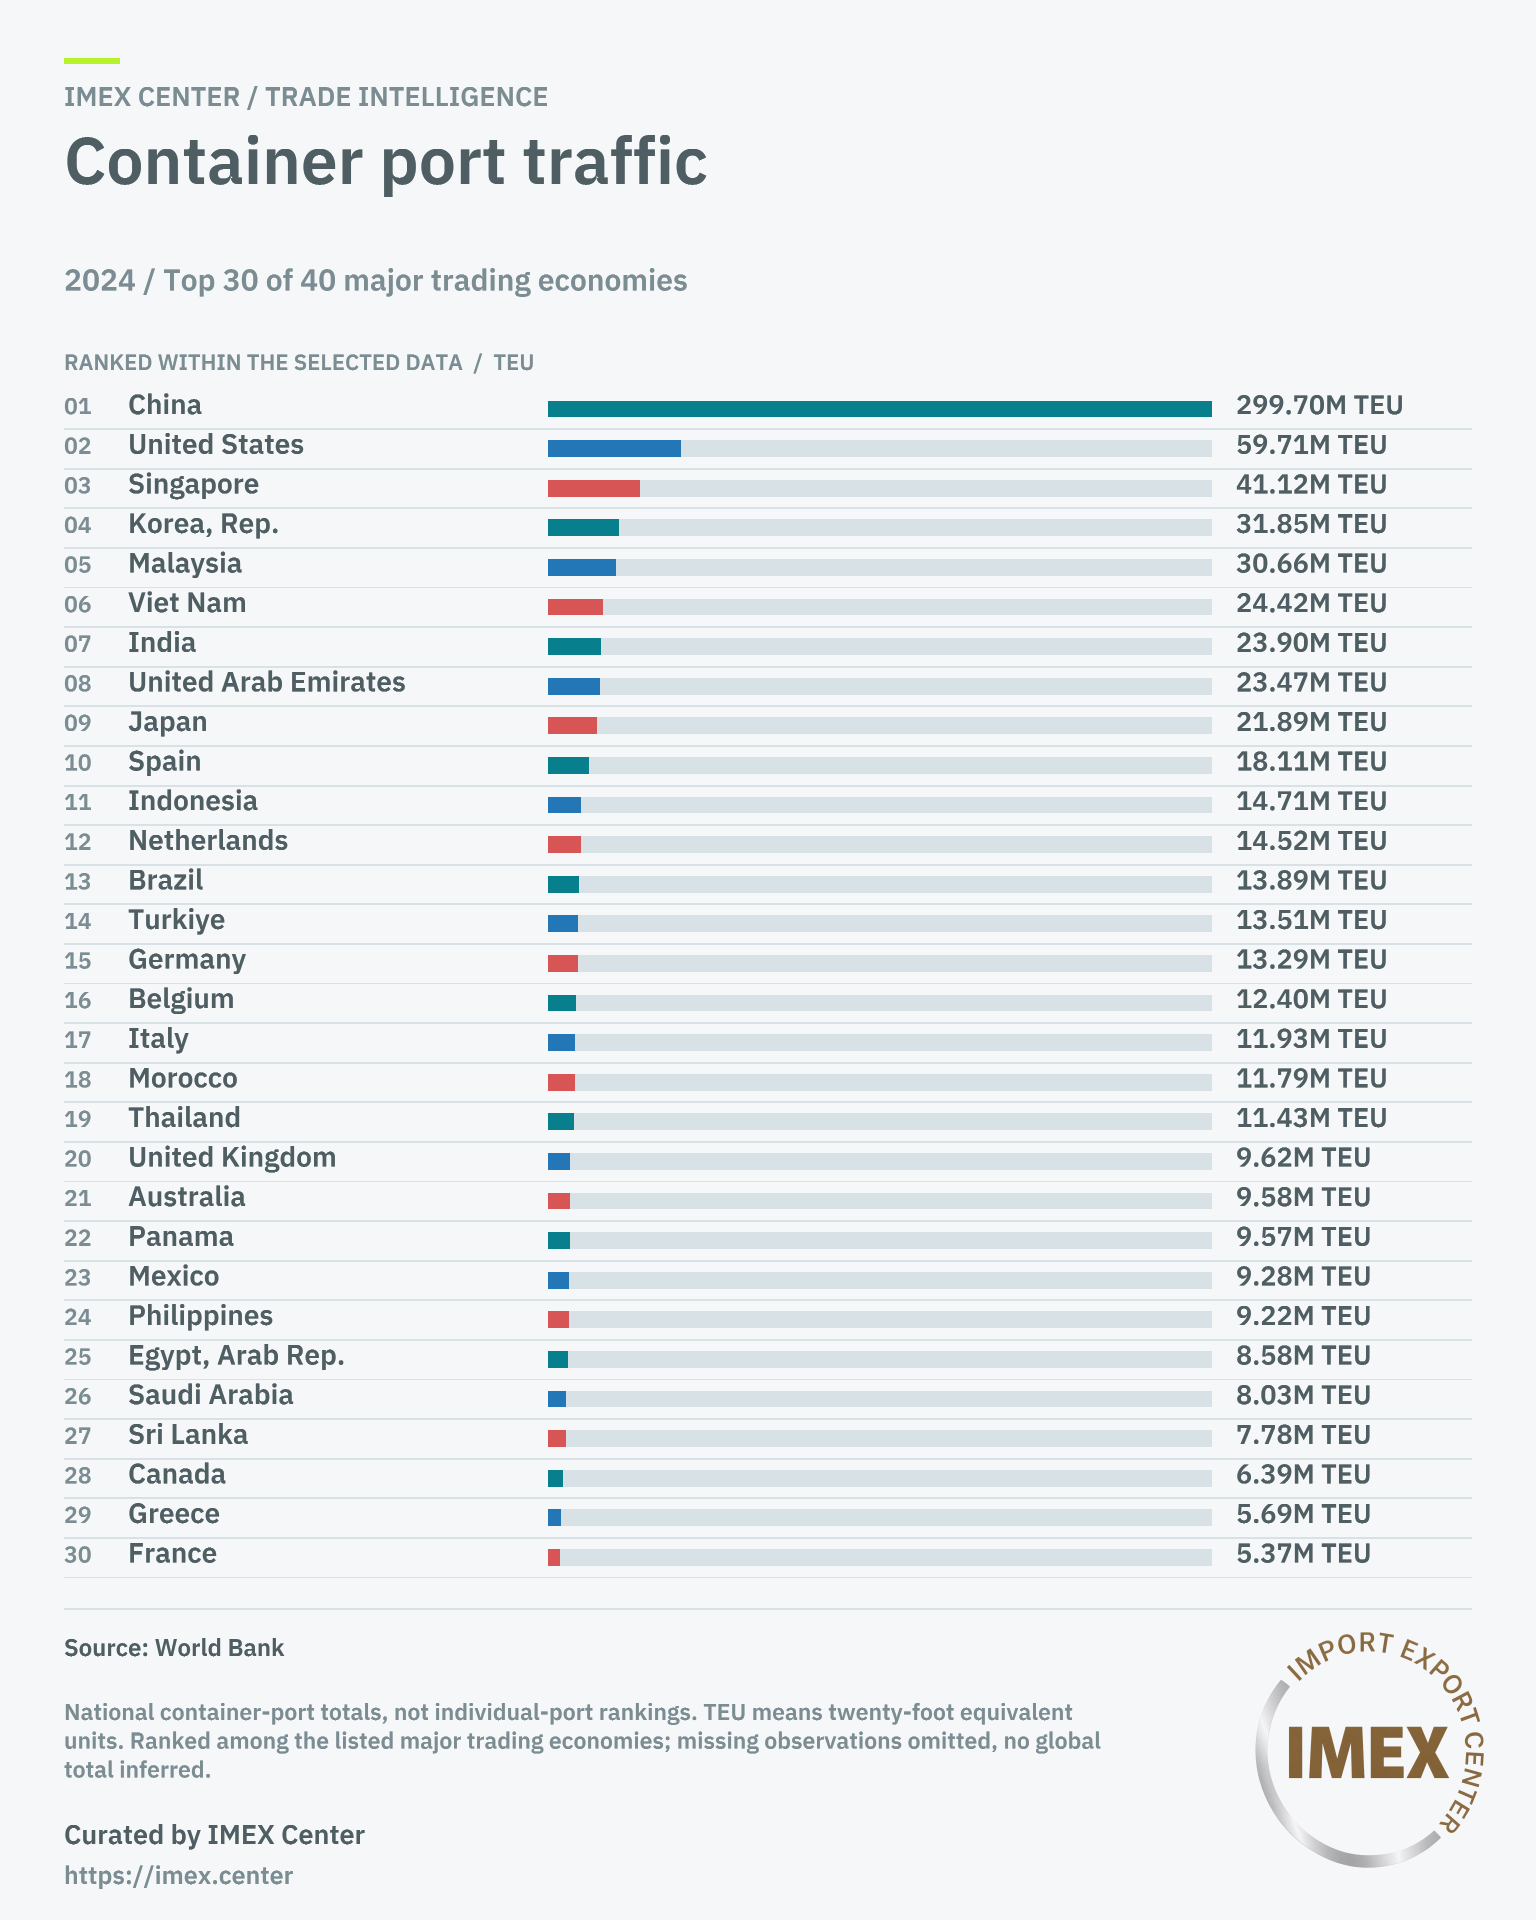
Container port traffic — Top 30 of 40 major trading economies (2024)
2024 · Top 30 of 40 major trading economies · Container port traffic: China 299.70M TEU; United States 59.71M TEU; Singapore 41.12M TEU.
| Rank | Top 30 of 40 major trading economies | TEU |
|---|---|---|
| 1 | China | 299,703,800 |
| 2 | United States | 59,707,490 |
| 3 | Singapore | 41,124,100 |
| 4 | Korea, Rep. | 31,850,924 |
| 5 | Malaysia | 30,659,850 |
| 6 | Viet Nam | 24,423,183 |
| 7 | India | 23,898,000 |
| 8 | United Arab Emirates | 23,466,906 |
| 9 | Japan | 21,886,683 |
| 10 | Spain | 18,114,517 |
| 11 | Indonesia | 14,709,550 |
| 12 | Netherlands | 14,517,179 |
| 13 | Brazil | 13,893,906 |
| 14 | Turkiye | 13,507,070 |
| 15 | Germany | 13,294,081 |
| 16 | Belgium | 12,395,047 |
| 17 | Italy | 11,927,016 |
| 18 | Morocco | 11,789,130 |
| 19 | Thailand | 11,432,626 |
| 20 | United Kingdom | 9,621,469 |
| 21 | Australia | 9,579,396 |
| 22 | Panama | 9,570,767 |
| 23 | Mexico | 9,284,170 |
| 24 | Philippines | 9,216,842 |
| 25 | Egypt, Arab Rep. | 8,581,339 |
| 26 | Saudi Arabia | 8,029,571 |
| 27 | Sri Lanka | 7,782,776 |
| 28 | Canada | 6,394,038 |
| 29 | Greece | 5,691,448 |
| 30 | France | 5,371,045 |
National container-port totals, not individual-port rankings. TEU means twenty-foot equivalent units. Ranked among the listed major trading economies; missing observations omitted, no global total inferred.
Curated by IMEX Center. Original sources:
The country handling the most containers is not necessarily the best gateway for your shipment. An unsuitable terminal, expensive inland journey or poorly timed connection can outweigh an attractive ocean-freight quote. Container port traffic by country provides useful context—but a booking decision needs evidence about your actual cargo, route and delivery deadline.
The supplied World Bank observations put China, the United States and Singapore at the top of the 30-economy comparison below for 2024. These are national container-handling totals, not rankings of port efficiency, freight affordability or market demand.
Use the figures to understand handling scale. Then move from country-level research to named terminals, current services and comparable written offers.
Container port traffic in 2024: 30 selected economies
The table presents every observation in the supplied evidence, ordered by container port traffic. Positions apply only to the 30 displayed economies. This is not a comprehensive global ranking or a confirmed top-30 ranking across the wider query selection.
| Position within displayed selection | Economy | Container port traffic, 2024 (TEU) |
|---|---|---|
| 1 | China | 299,703,800 |
| 2 | United States | 59,707,490 |
| 3 | Singapore | 41,124,100 |
| 4 | Korea, Rep. | 31,850,924 |
| 5 | Malaysia | 30,659,850 |
| 6 | Viet Nam | 24,423,183 |
| 7 | India | 23,898,000 |
| 8 | United Arab Emirates | 23,466,906 |
| 9 | Japan | 21,886,683 |
| 10 | Spain | 18,114,517 |
| 11 | Indonesia | 14,709,550 |
| 12 | Netherlands | 14,517,179 |
| 13 | Brazil | 13,893,906 |
| 14 | Turkiye | 13,507,070 |
| 15 | Germany | 13,294,081 |
| 16 | Belgium | 12,395,047 |
| 17 | Italy | 11,927,016 |
| 18 | Morocco | 11,789,130 |
| 19 | Thailand | 11,432,626 |
| 20 | United Kingdom | 9,621,469 |
| 21 | Australia | 9,579,396 |
| 22 | Panama | 9,570,767 |
| 23 | Mexico | 9,284,170 |
| 24 | Philippines | 9,216,842 |
| 25 | Egypt, Arab Rep. | 8,581,339 |
| 26 | Saudi Arabia | 8,029,571 |
| 27 | Sri Lanka | 7,782,776 |
| 28 | Canada | 6,394,038 |
| 29 | Greece | 5,691,448 |
| 30 | France | 5,371,045 |
Metric, source and coverage
The metric is Container port traffic, World Bank indicator IS.SHP.GOOD.TU. Every displayed observation has a reference year of 2024. The unit is TEU, meaning twenty-foot equivalent units. The subject is container traffic; the evidence provides no commodity HS-code breakdown or origin-to-destination corridor detail.
The source query names 40 economies, but the supplied observation extracts cover only the 30 displayed here. Those extracts support the figures and their ordering within this table. They do not establish the values or missing-data status of the other queried economies. Accordingly, this article does not claim that the displayed economies are definitively the top 30 of all 40.
Missing observations are not treated as zero. No omitted value is estimated, and no global total, global share or growth rate is inferred. Values are reproduced in TEU as supplied, rather than rounded into millions. Their displayed precision should not be interpreted as an independent assessment of measurement accuracy.
Source: World Bank, Container port traffic, indicator IS.SHP.GOOD.TU, selected-economy API query for 2024. This comparison uses the supplied official observation extracts; no separate live retrieval is claimed. Curated by IMEX Center. Curation means editorial selection and explanation, not independent certification.
What the supplied figures show
China records 299,703,800 TEU, the largest value in the displayed selection. The United States follows with 59,707,490 TEU, and Singapore records 41,124,100 TEU. These observations establish their order within this comparison, but they do not explain the composition of the traffic or the commercial conditions behind it.
Korea, Rep. records 31,850,924 TEU, followed by Malaysia at 30,659,850 TEU. Viet Nam, India, the United Arab Emirates and Japan also appear above Spain in the supplied ordering. None of these positions establishes that a particular sailing is available, reliable or suitable for a given shipment.
Spain records 18,114,517 TEU, the highest value among the European economies displayed. That is a comparison of national handling volume, not a recommendation to route European cargo through Spanish terminals. The final delivery address and available inland connections remain essential to that decision.
France closes the displayed selection at 5,371,045 TEU. Its position does not imply that a French gateway is commercially inferior. A lower-throughput economy may still offer the terminal location, service pattern and inland journey that best fit your cargo.
The central distinction is between historical activity and shipment suitability. These figures describe activity during the reference year. They cannot confirm current equipment availability, quote validity, congestion or sailing conditions. Without comparable observations from another year, they also cannot establish growth or decline.
How to interpret national container throughput
TEU is not a count of unique shipments
TEU expresses container traffic in a common size-based unit. It is not a measure of purchase orders, merchandise value, cargo weight or unique consignments.
Container handling can include empty equipment and transshipment movements. The supplied extracts do not separate these activities from domestic import and export movements. A national total therefore cannot be interpreted as the number of containers bought by local importers or sold by local exporters.
This matters particularly when assessing shipping hubs. Cargo handled in a hub may be moving onward to another market. A large throughput figure alone does not prove strong local demand for your product.
National totals cannot be assigned to individual ports
The geographic unit in this comparison is the economy, not a named terminal. The Netherlands’ national figure cannot simply be assigned to Rotterdam, nor can China’s total be attributed to a particular Chinese gateway.
Singapore is also presented as an economy-level observation. Its figure is not evidence about a particular terminal’s productivity, available capacity or handling conditions.
For an operational decision, identify the loading port, discharge port, terminals and onward delivery arrangement. If you need an individual-port comparison, obtain separate port-level evidence with matching periods and definitions rather than repurposing the national table.
Throughput is not an efficiency score
A high handling total says nothing on its own about how long your container will wait. The supplied evidence includes no measures of terminal dwell time, customs clearance, vessel delays or delivery reliability.
Ask providers for current information about the proposed service and terminal. Where they offer a transit-time estimate, establish what it covers and whether it is an indication or a contractual commitment. Do not present a national throughput position as evidence of faster clearance or more dependable delivery.
Turn the comparison into a practical freight enquiry
The useful next step is not to choose the highest-ranked economy. It is to define the shipment and obtain comparable responses from providers serving realistic gateways.
The buyer’s logistics lead should own this enquiry and resolve material uncertainties before booking. Procurement, finance and compliance teams should contribute the information that falls within their responsibilities rather than leaving the forwarder to infer it.
Define the shipment before requesting prices
Send each shortlisted provider the same brief. At minimum, include:
- Cargo description, intended use and any handling restrictions.
- Packing format, gross weight, dimensions and required equipment.
- Collection address and final delivery address.
- Cargo-ready window and required delivery window.
- Proposed Incoterms 2020 rule and the named place or port.
- Inspection, documentation and insurance requirements.
- Quote currency, required validity and requested charge breakdown.
- Any conditions affecting loading, unloading or receiving hours.
The procurement lead should confirm product and packing details before the RFQ is issued. The logistics lead should confirm the route assumptions and delivery scope at the same stage. Incomplete inputs tend to produce qualified offers that look comparable but cover different obligations.
Include a document reference, issue date, response deadline and authorized contact. Identify counterparties accurately, marking unverified legal identity or authority as pending verification rather than implying that checks have already been completed.
Ask for named terminals and service details
Require each provider to identify the proposed ports and terminals, not just the origin and destination countries. Request the service schedule, booking cut-offs, expected transit time and conditions for space and equipment confirmation.
Establish whether the service is direct or involves transshipment. If it involves a connection, ask for the planned transshipment location and the assumptions behind the onward schedule. A country-level traffic figure does not tell you whether those connections fit your delivery window.
For inland transport, request the handover points, transport mode and responsibility for collection and delivery. If you are comparing European gateways, have providers quote the same final delivery address and cargo-ready window. That makes the practical differences visible without assuming the highest-throughput economy offers the best solution.
Compare the whole charge scope
A low ocean-freight line does not establish a low total logistics cost. Request itemized origin, ocean, destination and inland charges, with exclusions, currency and validity clearly stated.
Ask about storage, demurrage, detention and applicable free time. Require the provider to explain the relevant triggers and charging basis rather than relying on a headline allowance. The logistics lead should resolve these terms before booking, especially where customs, inspection or receiving arrangements could delay collection.
Build a comparison sheet with a column for each offer and a row for each required service. Mark missing prices and exclusions explicitly. Do not treat an unquoted service as free or assume that an attractive base rate includes every destination charge.
Keep delivery rules separate from payment terms
Incoterms 2020 allocate delivery obligations, risk and costs. They do not determine payment terms or transfer of ownership, which must be addressed separately.
Choose a rule that fits the actual transport and handover arrangement. FOB, CFR and CIF apply to sea or inland-waterway transport; risk passes when the goods are on board at the loading port. Under CFR and CIF, the seller pays freight to the named destination port, and CIF also requires insurance. Payment of destination freight does not mean risk remains with the seller until arrival.
The commercial lead should confirm the delivery rule and named location before accepting the offer. Finance should separately review payment conditions and any bank requirements before commitment. If an LC at sight is proposed, remember that payment depends on complying documents, not automatic payment when the vessel arrives or a guarantee of goods quality.
A decision checklist before booking
Use the statistical comparison as research context, then require shipment-specific evidence for approval.
- Procurement owner—before commercial commitment: confirm buyer and supplier legal identities, authority, product specifications and any outstanding verification requirements.
- Logistics owner—before booking: obtain written confirmation of the proposed terminals, service, equipment, inland arrangements, charges and material exclusions.
- Finance owner—before accepting payment provisions: review currency, payment conditions, relevant bank acceptance and documentary requirements.
- Inspection owner—before inspection: agree the named independent inspector, sampling and testing methods, acceptance criteria and reporting scope where inspection is required.
- Contract owner—before signature: ensure the document accurately records agreed responsibilities, conditions precedent and which provisions are binding.
If a material point remains unanswered, return the offer for a written clarification or revision. Assign a responsible person and a response deadline linked to the booking decision. A missing commercial term cannot be repaired by pointing to a country’s throughput ranking.
For product-market research, run a separate workstream. Use appropriate commodity-level evidence, consistent units and matching years, and distinguish local imports from transit activity where the source permits. Container handling alone cannot establish demand for machinery, textiles, food ingredients or another specific product.
Frequently asked questions
Which economy leads this 2024 comparison?
China leads the 30 displayed observations with 299,703,800 TEU. The United States follows with 59,707,490 TEU, and Singapore records 41,124,100 TEU. These positions apply only to the displayed selection, not a confirmed global ranking.
Is this a verified top-30 ranking across all queried economies?
No. The source query names 40 economies, but the supplied observation extracts cover 30. The table reproduces and orders those supplied observations. Establishing the top 30 across the full query requires checking the remaining observations and their missing-data status.
Does higher container throughput mean a better port?
No. National throughput indicates handling scale, not individual-port efficiency, reliability or available capacity. Select a gateway using current service information, terminal suitability, inland connections and comparable charges for your shipment.
Can these figures identify product demand or freight prices?
No. The evidence contains neither a commodity HS-code breakdown nor freight-rate data. Product demand requires separate market research, while freight pricing requires a current quote tied to cargo details, equipment, named locations, shipment timing and service scope.
Turn trade research into a clear commercial requirement
The practical value of this comparison is a better enquiry—not a booking recommendation based on a table. Before approaching counterparties, define what you need, who will approve it and what evidence is required to proceed.
Importers and sourcing managers: prepare a buying requirement that connects product specifications with quantity, destination, delivery window and acceptance criteria. Keep supplier verification separate from lot-level quality evidence; neither should be assumed from a listing or certificate requirement.
Exporters and trading companies: prepare an offer that states origin, available quantity, packing, shipment schedule and delivery conditions. Identify deviations from the buyer’s request directly, and attach relevant evidence rather than making broad claims of compliance.
Logistics and procurement leads: prepare a consistent enquiry covering the shipment, route, inspection, insurance and payment-related responsibilities. Compare written provider responses before commitment, and carry unresolved conditions into the approval process rather than treating them as agreed.
Explore IMEX Center with that requirement ready. Confirm the platform’s current services and the scope of any verification or provider offer before relying on them.
Register at IMEX Center to take the next step as an importer, exporter or logistics professional—with a defined trade requirement, clear responsibilities and a shipment-specific basis for discussion.
Source or sell globally with IMEX Center
Browse verified suppliers →